Design without data is guesswork. No matter how visually appealing a website or app looks, its success ultimately depends on how well it performs for users. That’s where data-driven design comes in—a method that merges creativity with measurable insights.
In 2025, the best user experiences (UX) are not just imagined—they’re informed. Designers use analytics, heatmaps, A/B testing, and user behavior tracking to shape products that both delight users and meet business goals. Data removes the mystery from design decisions, ensuring every pixel has a purpose.
What Is Data-Driven Design?
Data-driven design is the practice of using real user data to guide design choices. Instead of relying on assumptions, teams analyze evidence from various sources—like user analytics, session recordings, surveys, and usability tests—to make informed decisions.
It’s not about replacing creativity with numbers—it’s about enhancing creativity with insight. Data helps designers understand what works, what doesn’t, and why.
When used strategically, data-driven design leads to:
- Improved usability
- Higher conversion rates
- Increased user satisfaction
- Stronger brand loyalty
It turns UX design from a subjective art into an objective, measurable process.
The Power of Analytics in UX Design

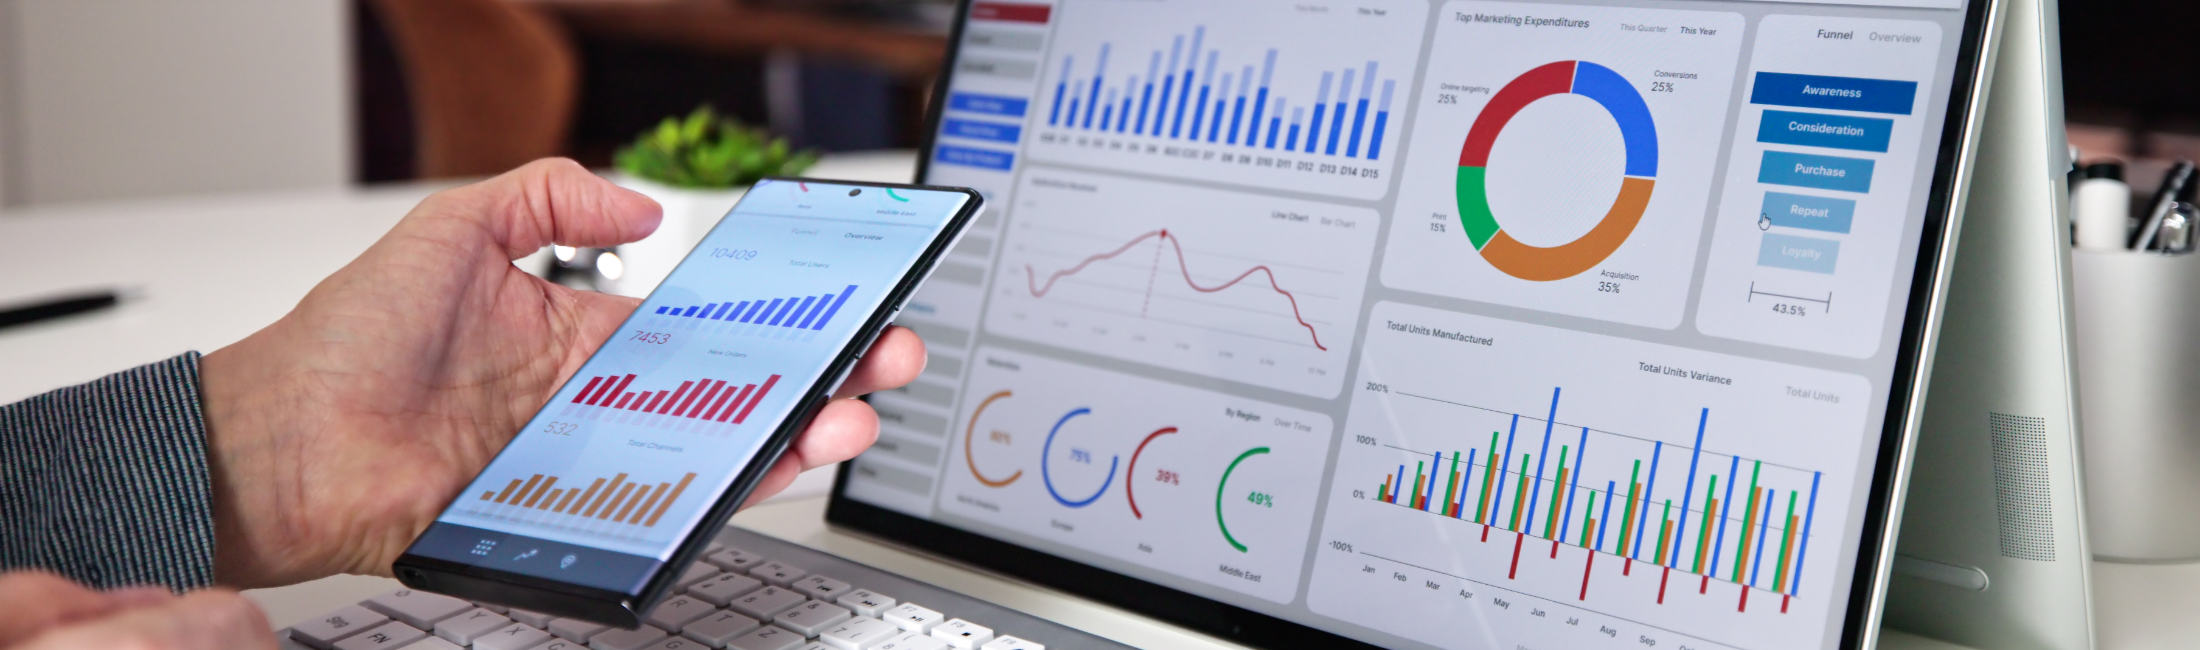
Modern analytics tools such as Google Analytics 4, Hotjar, and Mixpanel give designers an inside look at user behavior. They show how visitors interact with pages, where they click, and where they drop off.
Some key UX metrics include:
- Bounce Rate – Are users leaving too soon?
- Session Duration – Are they engaged?
- Click-Through Rate (CTR) – Are CTAs effective?
- Conversion Rate – Are users completing the intended actions?
By analyzing these metrics, designers can spot usability issues, identify high-performing pages, and understand what motivates user behavior.
For example, if users abandon a checkout page, analytics may reveal friction points—like too many form fields or unclear pricing—that designers can fix for immediate impact.
Qualitative Data: The Voice Behind the Numbers
While quantitative analytics shows what users do, qualitative data explains why.
Methods like user interviews, surveys, and usability testing uncover emotional and psychological insights—how users feel about an interface, what frustrates them, and what builds trust.
Combining both data types gives a holistic view:
- Quantitative = patterns and trends
- Qualitative = motivation and emotion
For instance, heatmaps might show users aren’t clicking a “Learn More” button. A follow-up user test might reveal that the wording feels vague. This blend of data and empathy drives smarter, more human-centered design decisions.
A/B Testing: Designing with Proof
A/B testing is one of the most effective data-driven design methods. It involves comparing two versions of a page or element—like a headline, button color, or layout—to see which performs better.
For example:
- Version A: “Start Your Free Trial”
- Version B: “Try It Free for 30 Days”
The version that leads to more conversions wins. A/B testing removes bias and validates design decisions with real-world evidence.
Tools like Optimizely or Google Optimize make it easy to run controlled experiments, turning every design update into an opportunity for measurable improvement.
Heatmaps and Session Recordings: Seeing Through the User’s Eyes

Heatmaps and session recordings offer a visual layer of understanding. They show where users move, scroll, and click—revealing behavior that’s often invisible in raw data.
A scroll map might reveal that most users never reach the CTA placed at the bottom of the page. A click map might show confusion if users repeatedly click on non-interactive elements.
By interpreting these insights, designers can rearrange layouts, improve navigation, and enhance the clarity of interactions—making the user journey smoother and more intuitive.
Personalization Through Data
Data-driven design doesn’t just fix problems—it creates opportunities for personalization. By analyzing demographics, behavior, and preferences, designers can tailor experiences that feel uniquely relevant.
For example, e-commerce platforms use browsing history to recommend products. Streaming services like Netflix analyze viewing data to personalize content suggestions.
This type of personalization builds emotional connection and boosts engagement. When users feel that a product “gets” them, they’re more likely to trust and return.
Balancing Data with Creativity
While analytics are powerful, relying on data alone can stifle creativity. The best UX designers blend data with intuition—using insights as a compass, not a rulebook.
Data can highlight patterns, but human imagination turns those patterns into innovation. Great design still requires storytelling, empathy, and visual craft. The goal isn’t to design for numbers—it’s to design for people, guided by numbers.
From Insights to Action: Building a Data-Driven Culture
True data-driven design extends beyond tools—it’s a mindset shared across teams. Designers, marketers, and developers must collaborate using the same insights to align creativity with measurable goals.
Creating a data-driven culture means:
- Setting clear UX metrics before launching designs.
- Testing and refining continuously.
- Treating every project as an evolving experiment.
When teams embrace this approach, products evolve faster, perform better, and consistently meet user expectations.
Conclusion: Designing Smarter, Not Louder
Data-driven design transforms guesswork into growth. By combining analytics, testing, and empathy, brands can create experiences that don’t just look beautiful—they work beautifully.
In a digital world flooded with choices, the products that win are those that listen, learn, and adapt. With every insight, the design gets sharper—and every user interaction, more meaningful.